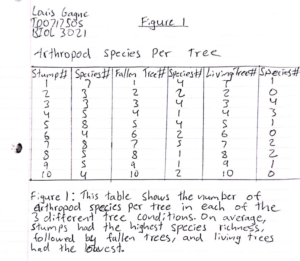
For my table and graph assignment, I reorganized my field note data into a table that is easier to read and interpret. I had already made a table while collecting my field data, but the information is difficult to understand because I added more replicates to my data after I had already structured the table. The biggest challenge that I encountered while structuring my table is that I have too many replicates to fit in one column of a page. To solve this issue, I decided to make a new column for each of the tree conditions and a column for the number of species beside the given tree condition. This table works, however, there could also be other ways to show this information.