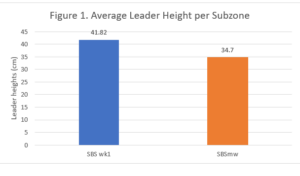
The above figure demonstrates the average leader heights taken of 25 trees per subzone (SBSwk1 and SBSmw). The average leader heights within the SBSwk1 was larger than that of the leader heights within the SBSmw by 7.12 cm, with a total of 41.82 to 34.7.
With this particular graph I didn’t run into any issues in organizing and summarizing the data. One of the other tables i created for my report, served a little more extensive and difficult due to the need for calculations to determine the values within the table.
The outcome of the above graph, matched the observation i made in the field prior to compiling the data. Nothing, thus far, within my data compilation has yet revealed anything unexpected. That said, at this time, I am still reviewing the raw data collected.