I have decided to conduct field observations of 10 minute observation intervals in 3 different areas of my back yard in Fort Simpson, NT.
Area 1 – side yard – predominately crab apple trees with some remaining crab apples, black poplar, and choke cherry.
Area 2 – left corner of back yard – predominantly black spruce and caragana.
Area 3 – right corner of back yard – predominantly wild rose, black spruce, red osier dog wood, and caragana.
My study will include 3 10 minute blocks of observations of wild birds within each area each Saturday morning from 10 – 11 am for 6 weeks ( Feb 17, March 2, 9, 16, 23, 30.)
Which area will have the most varied and abundant bird activity? I predict that Area 1 will be the most active and varied location due to the abundant variety of food sources.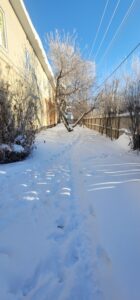 Area 1
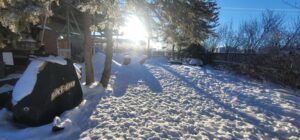 Area 2
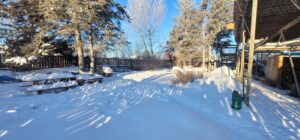 Area 3
This sounds like a good start and you have defined a sort of gradient. Would be good to see some more details like the size of each area and are they similar sizes? Why does area 1 have more food resources specifically?
Thanks for pointing out the study size. I will limit each area to 3m x 3m and by limiting the size this eliminates the chokecherry tree from the sample 1 area. As for why one area has more food sources than the others, I hadn’t thought of it as more sources but rather just different ones.
Area 1 last years crab apples
Area 2 this springs spruce buds
Area 3 last years rose hips, and dogwood berries.