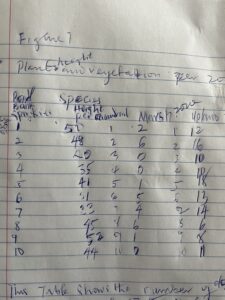
Data on target species populations gathered using the quadrant method are displayed in the table. The graph presents a comparison of the population and height with respect to the altitude of each chosen study zone, and the tables include the field study zones and the population of each species as reported in each study zone’s quadrant. The graph indicates that species that are tolerant are most abundant on the pond water bank, whereas species that are prone to extinction are less numerous in marshes as a result of deforestation, reduced water availability, erosion, and flooding.