In my study, I am looking at the relationship between bird species diversity and Rowan tree density.
Organizing and Analyzing the Data:
One of the primary challenges I encountered was organizing and summarizing the data effectively. I began using my Ipad to write down data but I quickly saw that I needed to transfer it to an excel sheet due to the amount of repetition/ data over a month that I planned to collect. It is a faster way to plug data in and save it efficiently, I had to also think that an excel sheet is necessary in order to plug data into R to analyze it.
With multiple measurements at some tree densities and only one at others, along with zero bird counts at several densities, I had to devise strategies to handle these variations. For this I categorized Rowan tree density into three ranges: 8-12, 12-16, and 16-22. This approach allowed for a more structured analysis, enabling to compare bird species counts across these categories.
Insights from the Analysis:
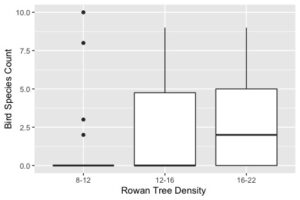
Analysis revealed intriguing insights into the relationship between Rowan tree density and bird species diversity. In the 8-12 range, I observed a significant proportion of data points with zero bird counts, suggesting a potential impact of lower tree density on avian habitats. However, there were also instances of high bird species counts, indicating the importance of other factors influencing bird presence.
Moving to the 12-16 range, I noticed a wider spread of bird species counts, with the interquartile range extending from 0.0 to just below 5.0. The presence of outliers further emphasized the variability in bird populations within this range, warranting further investigation into the underlying factors contributing to such diversity.
Similarly, in the 16-22 range, while the interquartile range spanned from 0.0 to 5.0, there was a notable solid line at 1.5 on the y-axis, suggesting a consistent presence of bird species counts at this value. This intriguing pattern prompts exploration into potential ecological factors driving this phenomenon and its implications for avian biodiversity.
Moving forward, my analysis has sparked ideas for further exploration. Investigating additional environmental variables such as habitat structure, food availability over even studying this over a larger period of time (years), could provide deeper insights into the factors shaping avian communities. Additionally, longitudinal studies tracking changes in bird populations over time could offer valuable perspectives on the dynamics of ecosystem health and resilience.
Hi, I already commented on your small assignment, figure is looking good!