I set out to do my field sampling on February 6th and 7th. Conditions were overcast both days, and temps were between -3 to 1 degrees Celsius. The first day I spent 6 hours completing the first half of the plots, and the second day approximately 8 hours to complete the remaining plots.
I used a combination of cross country skis and then snowshoes to access the general area of my the pre-determined random UTM location point of commencement (POC). I brought a keyson 100m survey rope and compass from work, and dragged the rope (transect line) from the POC at the random bearing direction I had pre-determined as well. I had pre-flagged intervals of 20m along the survey rope to guide my plot placement. I then used a elson tape to measure perpendicular 20m segments from the marked points along the transect (rope) and flagged these as my plot corners as I went.
From there, I found the best way to have visual surveillance of cavities up to the tops of the trees within the plot was to traverse the plot area slowly starting from the centre in concentric laps moving outwards to the plot edges. For reference I took a GPS point at the approximate centre of each plot. I brought an extendable ski pole, to which I taped my phone with video in the case any cavities were possible to inspect from the ground with this method. When I completed the first 100m segment, since my rope wasn’t long enough, I flagged the end point and dragged it further 100m in the same bearing direction. It was really challenging to get the rope and myself around various obstacles such as windfall or deep snow pockets.
The early and mid my plots on the first day were fairly efficient, as there were very few cavity trees, much like I expected – aside from the mid plots which involved a fair amount of bushwacking in thicker brush and deeper snow in areas with less canopy cover. The second day in the mature and old growth seral stage transects, the going was easier due to the sparser shrubby layer, but it was a challenge to see cavities that were higher in the canopy (taller trees). There were also more feeder and roosting cavities which needed to be differentiated. The survey took ended up taking longer where the trees were more mature and surveillance effort was higher. In both cases, access to and establishing the plot layout took considerable time.
In total I spent about 14 hours in the field in order to sample a total of 40 plots. There were 10 x 400m2 replicate plots per seral stage area.
I definitely reflected on my hypothesis while spending time in the woods. I saw that the only cavity tree within the early sample area consisted of a very old “remnant” burnt tree within the early successional surroundings. It really struck me how forest harvest practices could really influence the availability of these key habitat features (nest cavities) if all the decay class trees are destroyed within a harvest block.
I began to question just how natural the forest composition and structure was due to the uniform plantings apparent in the mid seral sample area. The block was planted in 1986 (according to signage) and was managed according to silviculture practices at the time. The present site lacked deciduous species and had a dominant tree layer of evenly spaced Douglas fir. I speculate that brushing, possible herbicide application, and thinning were all treatments applied to this area of regen. I have yet to find any data about this particular block. What was also shocking was absence of cavity trees in this sample area. I had expected to find a mid seral die off of deciduous providing a critical abundance of decay class trees for primary cavity nesters to take advantage off. This was not the case. Some of the literature I reviewed had suggested that the increase in competition in an aging forest (naturally) would contribute to the temporary provision of decay class trees.
Taking on a survey in an area that is influenced greatly by about a century of forest harvesting with evolving methods and standards, there are certainly going to be underlying factors related to this that influence the present site conditions and make it difficult to draw firm conclusions. For example even the old growth areas showed evidence of massive Douglas Fir remnant stumps from selective logging).
The human influence on forest structure and dynamics is only part of many variables at play in a complex forest system. What really stood out while thinking deeper about my research topic, was that it is not enough to simply stratify into 4 neat seral stage polygons using BCTS data and count the holes in trees. There are factors of soil moisture, micro-disturbance patterns or randomness, other disturbances like insect, fungal, or disease infestation that could in combination, influence the results. Then on top of that, there are many layers of species dynamics and abundances, such as that of primary cavity nesters that could also be considered.
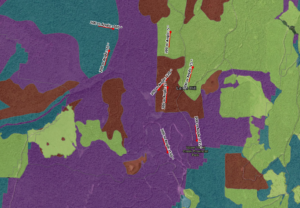
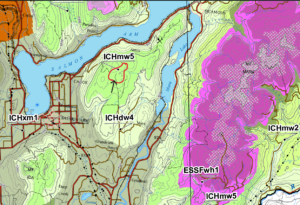
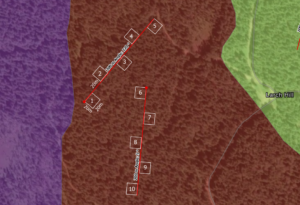
Here are some figures showing my sampling plans and the BEC zone and elevational characteristics of my selected study area. The last figure shows the plot layout along the 200m transects within the seral stage areas.