The biological attribute I plan to study is squirrels: Eastern Grey Squirrel and the Red Squirrel.
I set up three point count stations, all at minimum 50m apart.
My proposed hypothesis: Human activity influences squirrel activity or abundance
This will be a natural experiment.
Prediction: As human presence increases, squirrel activity or abundance will decrease.
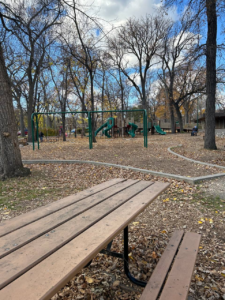
- Station 1 (High human activity with over 10 people in this area): Observed 5 squirrels -> all were undertaking in foraging behavior as they were on the grass
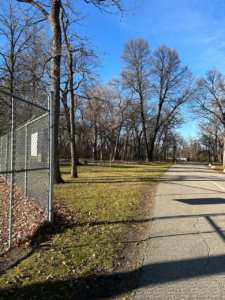
- Station 2 (Medium human activity with roughly 5 or 6 people around): 6 total squirrels observed
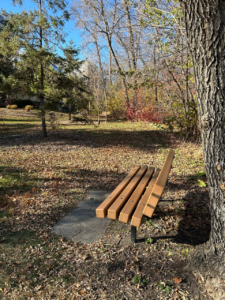
- Station 3 (Low human activity with only 2 people in the area): Observed 4 squirrels.
Variables:
- Response Variable: Squirrel abundance (Continuous)
- Explanatory Variable: Level of human activity (Categorical)
- Categories:
- High human activity -> 10 or more people around the count station
- Moderate human activity -> 5 to 9 people around the count station
- Low human activity -> 1 to 4 people around the count station
- Categories:
I stayed at each point count station for a total of exactly 10 minutes.
Here’s a quick description of these stations used:
Station 1 was by a play ground which explains why the human activity was so high as parents and children frequent, because I didn’t want to cause any discomfort taking pictures of the playground while children were around I took these pictures in an early morning when no one was around. Station 2 is the picture with the fence as there is a couple park benches along the road. As this road is connects the playground to a restaurant building, not too many people at the time were around and only a few people were walking down this road. Station 3 is the picture with the bench and the tree, this is located in a spot where there is hardly any human activity but many trees for squirrels to possibly be frequenting.
Additionally, squirrel behavior (such as foraging, chasing, vocalizations etc) was recorded in my journal at each station. These stations will be used for the next blog posts but will be labelled different numbers (I will be using 5 total point count stations visiting them at different times of the day recording squirrel behavior for robust data)
Remember to keep in mind if there are also habitat differences between your sites then that could also be influencing your results. Also, you might want to measure human activity more than once to characterize your areas. Also, consider how far your areas are apart and the home range size for squirrels – could the same squirrels be using each area?
Overall, it is a good start to a study design!