In my study, I scrutinized multiple variables such as temperature, species diversity, seedling abundance, and phylogenetic diversity across three main altitude zones:
1. Low Altitude (300-600 m)
2. Middle Altitude (700-900 m)
3. High Altitude (1000-1300 m)
The primary focus was to understand how these variables interact with each other and what they reveal about the resilience and diversity of arborvitae seedlings.
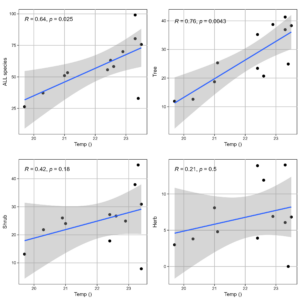
My data indicated that seedling species diversity was primarily influenced by temperature. Both Shannon-Wiener and Simpson diversity indices significantly and positively correlated with temperature (R = 0.40, P < 0.05; R = 0.38, P < 0.05).
Contrasting Trends in Tree Layer
Interestingly, large tree diversity in the tree layer did not significantly correlate with seedling species diversity. Also, neither large tree diversity nor the degree of depression correlated with seedling phylogenetic diversity.
Age vs. Abundance
The abundance of young and large trees was significantly higher than that of seedlings, suggesting that most tree species did not produce seedlings, while a few existed only as seedlings.
Altitudinal Diversity and Abundance
The highest number of seedlings and the most abundant species were found at lower altitudes, whereas the composition was more homogeneous at higher altitudes.
Challenges and Reflections
Data Aggregation
The key challenge was data aggregation, specifically aligning diversity metrics across various altitudinal ranges. Converting field measurements into meaningful data sets required rigorous verification and statistical analysis.
Was the Outcome Expected?
While I expected temperature to be a significant factor, its strong positive correlation with seedling diversity was insightful. Also, the non-correlation between large tree diversity and seedling diversity was somewhat surprising.
Room for Further Exploration
The strong influence of temperature opens up avenues for studying how climate change might impact these fragile ecosystems. Moreover, the non-correlation between large trees and seedlings suggests complex, possibly non-linear, relationships that warrant deeper study.
Conclusion and Next Steps
The data has given us valuable insights but also prompted new questions. Future work could include controlled experiments to validate these correlations and perhaps even reveal causations.
[sample data pictures, for full data, please check assignment5]
Make sure not to use raw R graphs in your final paper and see the tutorial on creating figures and graphs.
Remember that trees don’t create seedlings. They make seeds which are then dispersed by various methods and whether a seedling survives is influenced by many factors.
Also, be careful with your data interpretation. You can relate these data to climate change in your discussion but be careful not to make that jump in your results.