I noticed that there are more plants close to the street, near the pond and more plants facing the south than any other direction. The underlying processes that may be causing the patterns I observe is most likely the access to abiotic factors.
Flora with more access to artificial light, sunlight and water are most successful, they should therefore have higher density of plants and animals in areas with less limiting environmental factors. Based on this I made the following prediction. I predict there should be more plant diversity in areas with more access to abiotic factors such as, light and water, therefore I should find more plant species, animal species, insect carcasses, scat, and other forms of biomass near the street, south facing and closer to the pond:
H1: Access to abiotic factors will determine the distribution and abundance of flora and fauna.
H0: Access to abiotic factors does not affect the distribution and abundance of plants and animals in an ecosystem
PREDICTION: There will be higher density of plants and animals in zones of high light intensity and high-water accessibility
Response: continuous; number of each plant species in each zone e.g. number of echinacea/pine/spruce in a zone. number of animal sightings in each zone, number of insect carcasses found in each zone,
Explanatory: categorical; high or low access to a particular abiotic factor. E.g. Zone of high light intensity and low water accessibility
DATE: 11/08/2023.
LOCATION: Baldry Creek Park WPG, MB,
TIME: 12:00 PM CST,
WEATHER: +1 degree Celsius, chilly, sunny
SEASONALITY: Fall/Winter
OBSERVATIONS DAY1:
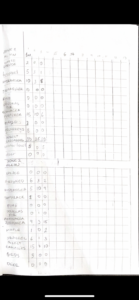
| low light intensity | High light intensity | |
| High water accessibility | Total of 73 plants and animals observed in a randomly selected location in ZONE 3 | Total of 86 plants and animals observed in a randomly selected location in ZONE 1
|
| Low water accessibility | Total of 61 plants and animals observed in a randomly selected location in ZONE 4
|
Total of 80 plants and animals observed in a randomly selected location in ZONE 2
|
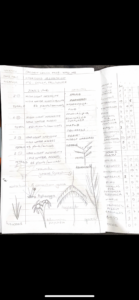
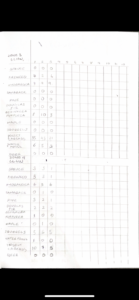
First, I will catalog the different plant species I see within my study area. (refer to field book images)
Next, I will apply a simple stratified sampling method. First, divide my study area into appropriate strata such that I get an unbiased representative sample. Because there seems to be a pattern of organization which I noticed incidentally that inspired my hypothesis, I believe stratifying my study location is most appropriate, like the marsh, wetland example, these are some sort of transition zones.
1st stratum: high light intensity: I noticed the areas with most light is closer to residential areas and facing has plants facing the south.
2nd stratum: low light intensity: This was determined as the opposite of the above criteria. There is less light in areas with buildings and plants with a north facing tendency.
3rd stratum: stratum: high water accessibility: this was determined by the proximity to the pond (close).
4th stratum:low water accessibility: This was determined by the proximity to the pond (far)
METHOD
I will investigate this by counting the number of plant species and animal species I observe within each zone. Totals exclude animal carcasses although I counted each incidence of one
There seems to already be an existing organization of low light/high light vs low water access/high water access. These strata are large, so I subdivided them.
2 factors (light/water)
2 levels (high/low)
4 treatment conditions. Zones of high light/high water, low light/low water, high light/ low water, low light/high water.
I randomly selected 3 distinct locations within each zone/treatment condition, i.e. 6 representative sample locations for each stratum/factor level.
I placed 2, 2-meter length ropes perpendicular to each other and counted each incidence of plant or animal at 4 right angles spanning the 2-meter length of the rope. 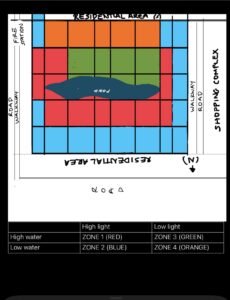
I think your overall idea will work but there are a few details I am unclear on. First of all, I am unsure of your high vs. low light. You will need to measure light in these areas to be able to say they are different. Your general observation of having less light closer to buildings is not clear to me. Do you mean these areas are in the shade more of the day? You likely need to quantify this somehow or at the very least describe it in more detail.
Similarly, for water availability you need to be more specific than near and far. What is near and what is far and what is the water availability in these areas? If you do distance from the pond you may not need to quantify water availability in order to define your categories, but you will want a detailed description of how you are defining these categories. Is close to the pond within a certain distance. Is it standing water or are you above the high water mark for this time of year?
Your hypothesis should be specific to the factors you are measuring and not just abiotic factors. Avoid using terms like ‘will determine’. Instead use will influence the distribution and abundance. Also, are you measuring distribution or just abundance. Or are you going to measure diversity?
Are you measuring all plant species or just the trees you referred to? You will want to choose a sample unit that is appropriate for what you are measuring. Given how many plants were in your initial samples, I would go for a smaller quadrat and more samples so you can get more independent replicates.
I would recommend you focus on either plants or animals and if you do animals to focus on one specific taxa. It can be difficult to write a paper that spans multiple taxa. The theoretical background and processes at work for the distribution of plants may differ from animals and differ between taxa. Also, your sample unit should be different for insects vs. plants.